


Mark Twain once said that September is a particularly difficult month to invest in stocks. Of course, he went on to comment jokingly that the other 11 difficult months included all other 30-day periods that comprise the calendar. Well, not true this September.
The S&P 500 advanced over 2% for the month, and its current price level of over 6,600 now stands very close to record high territory and smack dab in the 6,600 to 7,000 range we established as a likely price target for the 2025 calendar year. It’s no fluke that it’s advancing in our mind; there are sound fundamental catalysts supporting these gains.
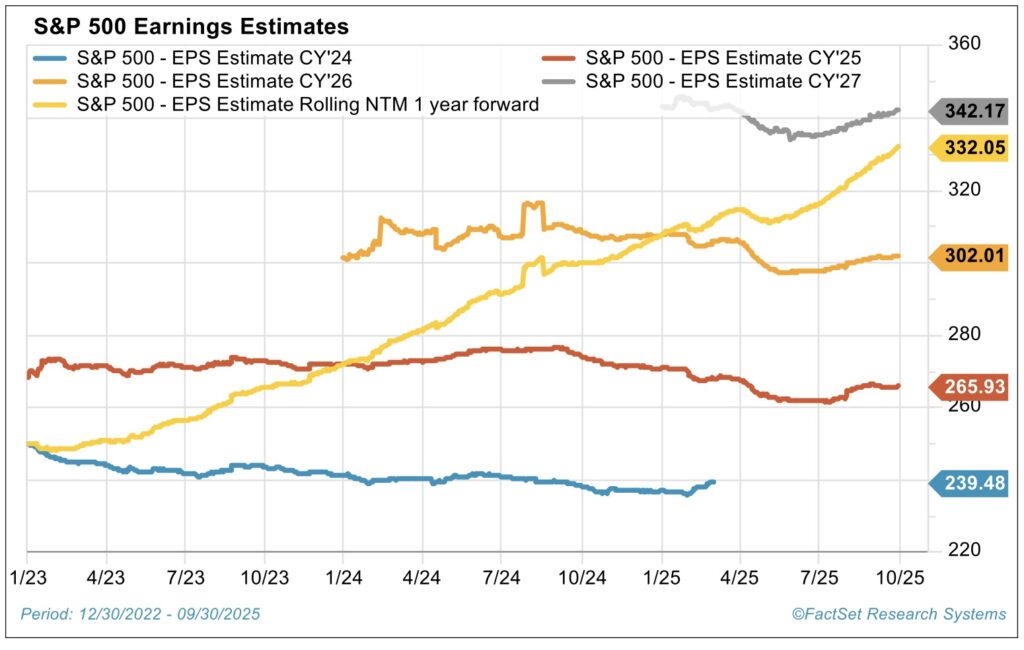
The retail sales figures released in September were solid and demonstrate that consumers are still spending. Unemployment claims remain very low and real wages—wages after inflation—continue to grow. Earnings are stellar, with forward 12-month S&P 500 earnings figures rising.
We appear to be in the midst of a labor productivity renaissance, thanks in part to good old American innovation and advancements in AI technology. As of Sept. 30, 2025, The Atlanta Fed’s GDP Nowcast model suggests real GDP growth should be approximately 3.9% in the third quarter, on the heels of solid 3.8% growth in the second quarter.
All this being said, there are valid concerns out there and the list of items that populate the wall of worry list isn’t getting any shorter. Seemingly chief among the issues is angst about the path and pace of Fed policy.
The soft labor report released in early September revealed that payroll growth weakened significantly in August. A subsequent labor market report unveiled significant negative revisions to the prior months’ payroll figures and informed us that more than 900,000 fewer jobs had been created over the last year than we had thought to be the case. This was the largest such revision on record.1
Together with these weaker labor reports, better-than-feared (yet still sticky and elevated) inflation data put the Fed on center stage going into the much-hyped Sept. 17 Federal Reserve meeting.
The Fed Struck the Right Chord…Bravo!
At its press conference immediately following its mid-September gathering, the Fed announced the first rate cut of the year—a modest 25 basis points reduction.
In rather impressive fashion, the Fed seemed to take a page directly out of the collective works of Mahatma Ghandi, who once said: “Happiness is when what you think, what you say, and what you do are in harmony.” In this vein, the Fed’s dot plot forecast, its statements expressed at the post-meeting press conference and its decision to employ a moderate, measured 25 basis point cut were all congruent.
Better said, all three of these elements—thinking, commentary and deeds—were in harmony. Importantly, markets welcomed that consistency in the Fed’s decision-making process and messaging, with the reaction in both stocks and bonds muted. This benign, undramatic market reaction to the decision signals that, at present, investors are comfortable with this factual, data-driven approach.
But harmony does not mean the path forward is easy—the challenge now is maintaining balance as policymakers navigate an economy that is slowing a bit, albeit not stalling.
The Fed is walking a tightrope in setting monetary policy, and the risks of missteps are clear. Despite warnings of probable recessionary or stagflationary outcomes unless rate cuts occur swiftly and aggressively, the economy is in far better shape than that narrative suggests.
Growth is moderating, yes, but it remains positive. Earnings growth is strong, credit spreads are tight and unemployment is still at historically low levels even as hiring eases. Inflation has cooled but is not yet defeated.
Against this backdrop, the modest 25 basis point cut in September was the right move in our view, striking a balance between supporting the economy without overstimulating it. The Fed’s own projections call for GDP growth of 1.6% this year, inflation settling just below 3% and unemployment holding near 4.5%—all broadly aligned with our base case outlook.2
Calls for more aggressive Federal Reserve rate cuts from the White House administration and from other circles may sound appealing, but history shows that giving in to such pressure often backfires—à la Fed Chair Arthur Burns succumbing to former President Richard Nixon’s lobbying to reduce rates back in 1972. That ignited a wave of hyper-inflation that took more than a decade to cure.
If the Fed adds too much fuel to a still-growing economy, inflation could flare up and force rates higher down the road—the opposite of what those calling for deeper cuts actually want. On the other hand, if the Fed keeps policy too restrictive for too long, it risks choking growth and pushing us into recession.
By choosing the middle ground and with near-consensus among voting members—surprisingly, 11 of 12 Fed committee members supported the smaller 25 basis point cut—the Fed sent the most reassuring signal possible: policy remains steady, disciplined and in control.
But What About Labor Market Conditions? Fact Versus Fiction
Advocates of rate cuts may point to the disappointing August jobs report—just 22,000 new payrolls and a three-month average of only 29,000—as evidence of a weakening economy.3 But that single headline print doesn’t tell the whole story.

The labor market is slowing, but it’s far from broken as headlines often suggest. Yes, the August payrolls number was weak, and the three-month average of just 29,000 jobs looks soft on the surface. The chart above illustrates just how much job growth has slowed, with August adding only 22,000 jobs versus a long-term average closer to 150,000.
But take a step back and the picture is more encouraging. The current unemployment rate of 4.3% has risen slightly from record lows, yet it remains at healthy levels and well below long-term averages of well above 5%. Businesses aren’t aggressively adding to payrolls, but they’re also not cutting workers in large numbers; initial claims for unemployment remain low.
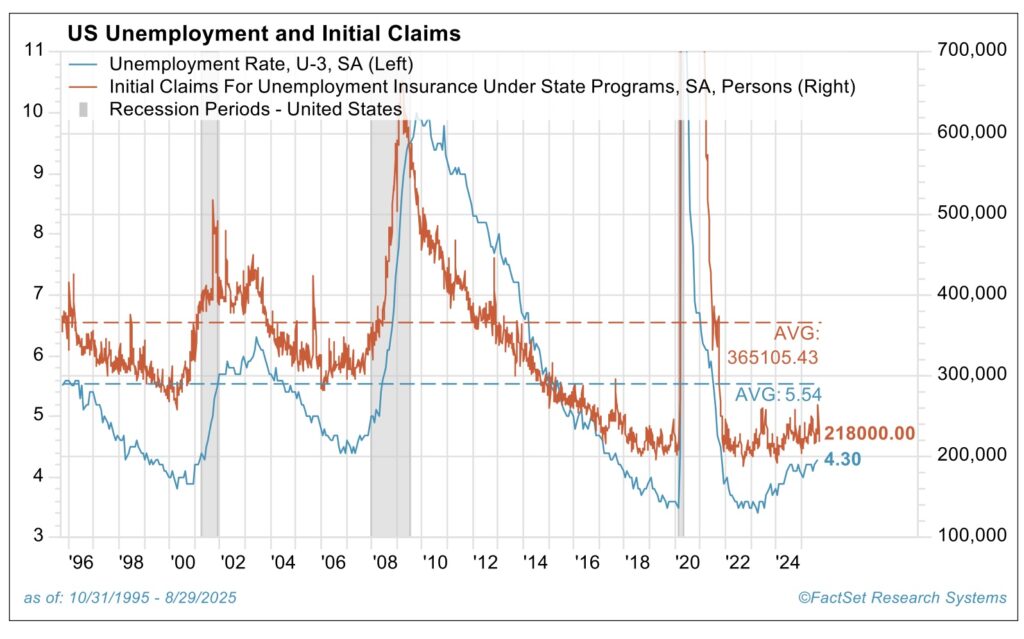
At the same time, productivity gains are strong, allowing companies to do more with the same headcount, reducing unit labor costs and supporting profit margins. Real wages are also rising at a steady, sustainable pace, which helps consumers without pressuring corporate balance sheets.
Looking at the entire mosaic—steady unemployment, resilient productivity and a lack of broad layoffs—the labor market is much healthier than the headline payroll number would suggest. We’ll be monitoring future monthly payroll reports closely, since it’s a major risk item flagged by Fed critics who worry our central bank is behind the curve in reducing rates and thus inviting recession. Stay tuned.
Valuation—Given Record High Stock Prices, Are We in a Price Bubble?
Since Dec. 31, 2022, the S&P 500 has delivered a cumulative return of 96%. That includes this year’s advance of more than 13% so far (after annual gains of roughly 25% each in both 2023 and 2024). With that kind of performance, this is an understandable question on investors’ minds.
Fed Chair Powell’s comments the week of Sept. 22 that stock prices are relatively elevated echoed the cautionary phrase “irrational exuberance” first uttered on Dec. 5, 1996 by then renowned acting Fed Chair Alan Greenspan. Of course, we know how well that valuation warning by Mr. Greenspan was timed. The S&P went on to rise over 101% from that Dec. 1996 date through the tech bubble peak in March 2000.
The point? Valuation alone is not an effective tool in evaluating market outlook, especially when the fundamental data and technical price trends are as constructive as they are today. In our view, it takes a comprehensive assessment of the fundamental, valuation and technical metrics to judge market prospects.
In that vein, market technical set up nicely at this juncture. We like the still-skeptical, sober sentiment, with current bull/bear ratios remaining neutral rather than euphoric. We also view the breadth of this advance as healthy, reflected in the favorable number of stocks advancing versus declining. This is not a foreboding, narrow advance.
Further comfort lies in the knowledge that the average S&P 500 price target on the part peer market strategists also remains underwhelming, as opposed to settling-in at highly optimistic levels.
It’s important to note, the 2025 advance so far has not been driven primarily by rising P/Es; P/E levels have been volatile month to month in 2025, but they have remained pretty steady in that 22 to 23 times earnings level when comparing this Jan. 1, 2025 metric to today’s. Rather, it has been earnings growth that has been the main driver of price gains this year.
Yes, the S&P 500’s current P/E of 23 may look elevated when stacked against the oft-cited 50-year average of 16, but that comparison is both short-sighted and incomplete. This is not your grandfather’s index.
The composition of the S&P 500 has shifted dramatically, with innovation and the rise of technology and services-oriented companies replacing much of the goods-producing corporate footprint of decades past. As a result, both profit margins and return on equity (ROE) have moved structurally higher.
Over the past 25 years, the average ROE for the index was roughly 16%. Since the Great Financial Crisis, however, profitability has stepped up meaningfully, with ROE now closer to 19%.
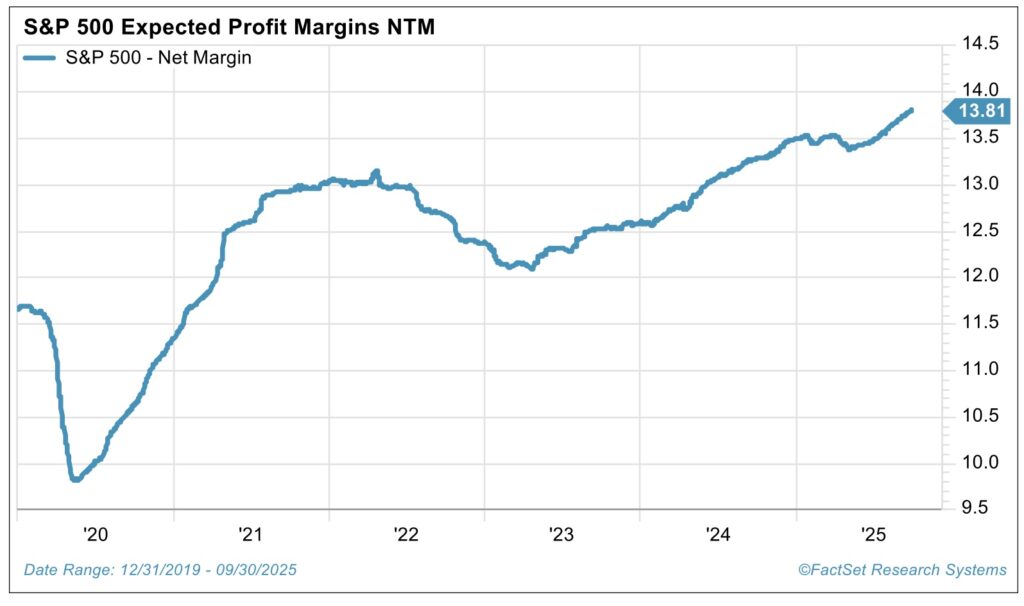
Net profit margins tell a similar story. They have averaged just above 9% over the past quarter century but are expected to reach an all-time high of 13.8% over the next twelve months.4 In that context, today’s multiple of 23x is not excessive. It’s supported by solid revenue growth, record-high margins and robust earnings power.
In addition, such strength appears to be sustainable as innovation is driving a surge in productivity growth (as mentioned earlier). Both the creators of that innovation—especially in the communication services and technology sectors, where monetizing the new, revolutionary AI-related products and services is still in the early innings—and the users across nearly every other S&P 500 sector are benefitting handsomely.
As a final point of context, we should also recognize that the S&P 500 equally weighted index—adjusted for the disproportionate influence of the largest 7 stocks (popularly known as the Mag 7) in the cap-weighted index—shows a P/E ratio of 17, much lower and close to the longer-term historical average. Reasonable enough given strong fundamentals.

What would concern us, on the valuation front, would be if P/Es pushed substantially higher from here, based simply on euphoria about possible further Fed rate cuts—especially if accompanied by a parallel rise in treasury yields.
The S&P 500 is more vulnerable should earnings figures disappoint in some fashion from here. We would not want to see market valuation “melt-up” in the near term merely on sentiment and on unwarranted joys about prospective fiscal or monetary policy “fixes.” This could lead to subsequent meltdown.
Steady eddy and an S&P 500 of 6,600 to 7,000 over the next several quarters would be just fine by us.
Seasonality and the Bigger Picture
In closing, many articles talk of the seasonally weak period in the August through October timeframe. September tends to be the worst month in the market: negative returns over half of the time, and one of the only months with an average negative return.
This year, the S&P 500 has bucked this tendency and generated healthy returns in August and September. Does this mean we are doomed for poor results in October (which is known to have some horrific results in years past) and over the course of the balance of the year?
For data junkies, you should be relieved to know that when returns for the S&P 500 are 10% or greater in the first eight months of the year (like this year), the S&P 500 posts positive returns in the final four months 75% of the time.5 But we don’t hang our hat on stats that lack causation in making our assessment—we rely on the fundamentals, valuation and technicals (FVTs). They remain constructive and supportive of our Clear Air Turbulence thesis.
Headlines about the government shutdown and ongoing speculation on what the Fed should/will do will continue to create temporary air pockets, but we look for the market to recoup and achieve higher blue-sky altitude as we move on into 2026. Hold your ground!
Sources:
1Bureau of Labor Statistics Annual Benchmark Revision Report, September 9, 2025
2Federal Reserve Summary of Economic Projections, September 17, 2025
3Bureau of Labor Statistics
4FactSet
5FactSet analysis period is from 1928 through 2024
This commentary is provided for informational and educational purposes only. As such, the information contained herein is not intended and should not be construed as individualized advice or recommendation of any kind.
The opinions and forward-looking statements expressed herein are not guarantees of any future performance and actual results or developments may differ materially from those projected. The information provided herein is believed to be reliable, but we do not guarantee accuracy, timeliness, or completeness. It is provided “as is” without any express or implied warranties.
Equity securities are subject to price fluctuation and investments made in small and mid-cap companies generally involve a higher degree of risk and volatility than investments in large-cap companies. International securities are generally subject to increased risks, including currency fluctuations and social, economic, and political uncertainties, which could increase volatility. These risks are magnified in emerging markets.
Fixed-income securities are subject to loss of principal during periods of rising interest rates and are subject to various other risks including changes in credit quality, market valuations, liquidity, prepayments, early redemption, corporate events, tax ramifications, and other factors before investing. Interest rates and bond prices tend to move in opposite directions. When interest rates fall, bond prices typically rise, and conversely, when interest rates rise, bond prices typically fall.
There is no assurance that any investment, plan, or strategy will be successful. Investing involves risk, including the possible loss of principal. Past performance does not guarantee future results, and nothing herein should be interpreted as an indication of future performance. Please consult your financial professional before making any investment or financial decisions.
Indexes referenced are unmanaged and cannot be directly invested in. For index definitions visit https://www.marinerwealthadvisors.com/index-definitions/.
Mag 7 stocks refer to Alphabet, Amazon, Apple, Meta, Microsoft, Nvidia and Tesla.
Investment advisory services are offered through Investment Adviser Representatives (“IARs”) registered with Mariner Independent Advisor Network (“MIAN”) or Mariner Platform Solutions (“MPS”), each an SEC registered investment adviser. These IARs generally have their own business entities with trade names, logos, and websites that they use in marketing the services they provide through the Firm. Such business entities are generally owned by one or more IARs of the Firm, not the Firm itself. For additional information about MIAN or MPS, including fees and services, please contact MIAN/MPS or refer to each entity’s Form ADV Part 2A, which is available on the Investment Adviser Public Disclosure website (www.adviserinfo.sec.gov). Registration of an investment adviser does not imply a certain level of skill or training.
Material prepared by MIAN and MPS.